In corporate learning, it’s easy to measure “activity”: logins, hours, completions… But if the goal is to support the business, the real question is: are you measuring what actually changes performance?
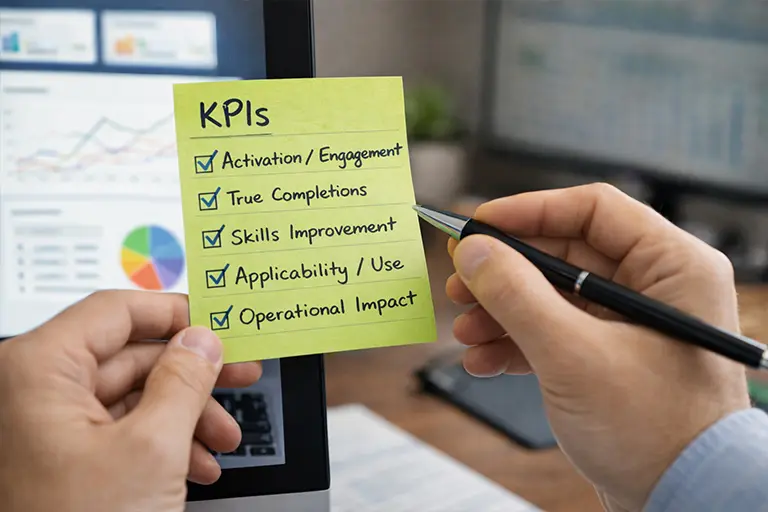
In 2026, a strong L&D strategy needs analytics that drive decisions: what works, for whom, when, and what impact it has. Here are 5 KPIs that help you manage with clarity (and prove value to leadership).
1) Activation and return visits (not just “active users”)
Someone logging in once doesn’t mean much. What matters is whether learning becomes a habit.
What to track:
• Activation: % of people who start a learning path or learning piece within the first X days.
• Return visits: % who come back (weekly/biweekly/monthly) and how many sessions they have.
• Frequency: interactions per learner within a given period.
Decision it enables: spot whether your format, channel, and engagement tactics are working—or whether you need stronger communication, gamification, or personalization.
2) True completion per piece (and drop-off points)
In microlearning, the KPI isn’t “finished the course”—it’s which pieces are watched end-to-end and where attention drops.
What to track:
• Completion per micro-lesson: % who reach the end.
• Time-to-drop-off: the exact minute/second where people leave.
• High-friction pieces: content that’s repeatedly abandoned.
Decision it enables: optimize content (intro too long, too much theory, not enough examples) and prioritize improvements where impact will be highest.
3) Skills progress (progress by capability)
The business doesn’t need “more course completions”. It needs people to improve specific skills. That’s why measuring by capability is more useful than measuring by catalog.
What to track:
• Competency level: before/after (self-assessment + quiz + practical evidence).
• Progress by role: which groups advance and which stagnate.
• Skill gaps: critical capabilities with low improvement.
Decision it enables: reallocate learning investment toward skills that actually sustain performance and adapt pathways by profile.
4) Applicability (from “I liked it” to “I used it”)
Satisfaction matters, but it’s a weak signal if it doesn’t translate into action. This KPI checks whether learning shows up in day-to-day work.
What to track:
• Immediate pulse: “Is this useful for your role?” (1–2 quick questions at the end).
• Delayed pulse (7–14 days): “Have you applied it?” “In what situation?”
• Barriers: “What prevented you from applying it?” (time, process, manager support, lack of tools).
Decision it enables: shift content toward real use cases, identify operational blockers, and trigger reinforcements (micro-lessons, nudges, contextual support).
5) Operational impact (the bridge KPI between learning and business)
This is the KPI that helps most with decision-makers: connecting learning to work indicators. It’s not always easy, but it’s achievable if you define what you want to move.
What to track (by area):
• Onboarding: time to autonomy / ramp-up.
• Operations: fewer errors, incidents, rework.
• Customer service: response time, NPS/CSAT, first-contact resolution.
• Compliance: on-time completion and fewer non-conformities.
Decision it enables: prioritize programs that move the business and justify investment with evidence.
Common measurement mistakes (and how to avoid them)
• Measuring too late: define KPIs before you launch.
• Only tracking vanity metrics: completions without context don’t explain impact.
• Not segmenting: measure by role, seniority, department, and country.
• Not closing the loop: measuring without optimizing wastes value.
How FIT applies this with SmartMobile LMS: analytics to make decisions, not just reports
At FIT Learning, the goal of analytics isn’t to create pretty reports—it’s to help you make faster, better decisions. With SmartMobile LMS, you can combine consumption, engagement, and skills evolution to understand what activates each audience and which pieces need reinforcement.
And when you add AI, you can go further: role-based recommendations, early drop-off detection, and continuous optimization of learning paths and microcontent.
Conclusion: the right KPIs save time, money, and frustration
If you measure activation, true completion, skills progress, applicability, and operational impact, you’ll have a far more reliable view of your learning strategy. Most importantly, you’ll be able to prove value with data and improve continuously.
Do you want us to review your KPIs and your dashboard?
At FIT, we can help you define a practical, actionable measurement model for your learning strategy: what to measure, how to set it up, and how to turn it into decisions.
Email us at fitls@fitls.com or visit fitls.com, and we’ll review your case (roles, objectives, and metrics).